Crown Castle: Diversifying from Great to Good
It is hard to believe that after outperforming the S&P by 87% over the last five years Crown Castle has drawn the ire of one of the country’s most prominent activist investors, Elliot Management. Maybe more surprisingly, it looks like Elliot is on to something.
Crown’s core industry – owning U.S. wireless towers – has been described as perhaps the “BBE”, or Best Business Ever. Despite the company’s success relative to the S&P, they have woefully underperformed their peers. Since 2010 Crown shareholders have underperformed the other two “Big Three” tower companies, American Tower and SBA Communications, by 125% and 313%, respectively.
On July 6th Elliot publicly released a letter to Crown’s board suggesting a number of changes to improve shareholder returns and close the performance gap. They call for the company to:
- Implement an ROI-focused capex program
- Overhaul the executive incentive plan
- Boost dividends
- Improve board oversight
For those not familiar with the wireless tower business, I’ll provide a brief industry overview and then turn to Crown’s capital allocation and incentive structure blunders.
Below is one of our favorite images that describes value drivers over differing time periods. As long-term investors we are most interested in studying and owning businesses with high returns on capital that are run by capable capital allocators, which are usually accompanied by an owner-minded culture.

Source: www.eaglepointcap.com
Crown Castle’s relative results over the last decade help highlight the importance of capital allocation and the impact it can have on returns for shareholders over long periods of time.
Tower Industry Overview
Chuck Akre of Akre Capital Management has made a fortune investing in American Tower and SBA. Akre describes tower companies as “bottleneck businesses”, one of his favorite types of investments. According to Akre:
“We think of a bottleneck business as one that a) sits atop large, global, secular growth opportunities fed by multiple industries and geographies, b) has those opportunities funneled (hence the bottleneck visual) disproportionately to it because of sustainable competitive advantages, and c) enjoys exceptional economics, often superior to the industries and customers the business serves.”
Source: Elliot Presentation
Tower owners fit squarely in this group due to the secular growth of mobile investments from wireless carriers, the mission critical nature of wireless towers, and the attractive economics associated with tenant contracts.
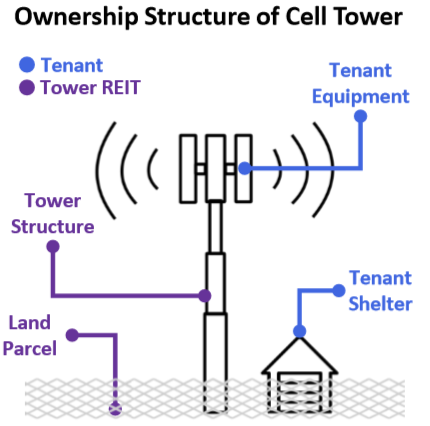
Tower companies own and control the structure and land used in transmitting wireless communication. They rent the structure to tenants such as AT&T or Verizon, who install and operate their equipment under long-term contracts.
Tower owners benefit from several factors, including:
- Favorable customer contract structures;
- A sticky customer base;
- Built-in price escalators;
- Massive (95%+) incremental margins from additional tenants;
- Long-term secular mobile network investment trends
Contract Structure
Wireless carriers typically sign five to 15-year initial contracts with multiple five to 10 year renewal periods and limited termination rights. The long-term nature of these contracts results in a highly recurring revenue base.
Sticky Customer Base
Tower companies provide an essential service to wireless providers, who in turn receive an excellent value proposition. Per an in-depth industry study on Scuttleblurb, a wireless carrier will pay roughly $20K to lease a tower, which is ~2% of the roughly $1.2M in revenue it generates annually from the ~1,200 connections from that tower.
Due to the essential nature of the towers and low relative cost, churn is extremely low. Typically, only 1-3% of Crown’s tower customers do not renew in any given year.
Price Escalators
Contracts come embedded with 3-4% annual price escalators, making the towers more profitable each year with little incremental investment required. Again, the relative price to value makes it unlikely for the tenants to push back on these modest annual price increases.
Incremental Margins

Source: Elliot Presentation
The real magic for the tower companies comes in adding multiple tenants to a tower. With one tenant, Crown might only make a 3% return on its investment. With virtually all of the towers’ costs fixed (maintenance capex is only 2% of revenue), 95% of the rent from a second and third tenant drops to the bottom line, resulting in high-teens returns for fully utilized towers.
Secular Tailwinds
Finally, the industry benefits from ever increasing capex from wireless carriers fed by increasing data demands and mobile traffic. Mobile usage is estimated to have risen 350x from 2009 to 2022 and 5x since 2017 alone. Carriers have spent $28B on the 4G rollout annually since 2010, with a 5G wave already in the works.

Source: Crown Castle Investor Presentation
When carriers go through an upgrade cycle from (3G to 4G for example) tenants install new equipment and amend leases resulting in higher revenues for tower owners. Most international markets are earlier in the network development cycle than the U.S. and American Tower and SBA believe many of these markets are where the U.S. was 5-10 years ago.
American Tower, Crown, and SBA own something like 65% of the wireless towers in the U.S. with the remaining tower companies playing a much less significant role. After explosive growth in U.S. tower counts through 2015 the market has matured and is now growing much slower.
As the domestic market reached maturity the Big Three made differing capital allocation decisions to drive their next phase of growth.
Divergence in Capital Allocation
American Tower and SBA Communications chose to remain in their circle of competence as pure-play tower companies. Each business dedicated capital to aggressively acquire tower assets abroad. Crown chose to remain focused on the U.S. and invest in Fiber and Small Cell assets starting in 2015.

Source: Elliot Reclaiming the Crown Presentation
Fiber-fed small cells basically boost carrier network capacity in areas of high network utilization to reduce outages in densely populated areas. The theory behind owning small cells is similar to owning a tower. Crown owns the fiber assets installed on utility poles and rents out the space to wireless carrier tenants to install and operate their equipment.

Source: Crown May 2020 investor presentation
Crown believes the economics of owning fiber and small cell assets will be akin to owning towers eventually, but there is reason for skepticism. As Elliot noted, most of the attractive qualities enjoyed by tower owners are dampened or non-existent in small cell, at least so far. From contract structure to competition, Towers are the clear winner.

Source: Elliot presentation
Ultimately the proof is in the pudding and comparing the differences in incremental returns on capital and shareholder returns should highlight who has allocated capital more intelligently thus far.
Diverging Returns on Capital
Crown has invested close to $30B in its business ($15.7B of it in fiber) since 2010. Over the same time period EBITDA grew by $2.2B for an 8% incremental return.
Compare this to American Tower and SBA who have each earned 11% on capital invested since 2010, nearly 40% better than Crown. Given American Tower and SBA have nearly identical strategies, it’s not surprising their returns are the same.
Note: in this case it’s helpful to use EBITDA when comparing businesses and management teams in the same industry to normalize for different capital structures and tax rates as well as the fact that real estate general appreciates rather than depreciates.
Crown’s fiber investments are clearly underperforming its tower investments and dragging down overall return on invested capital.
Not surprisingly, worse relative returns have resulted in slower earnings growth. Over the past five years Crown has increased adjusted funds from operations per share (AFFO is a key earnings and valuation metric for REITs) by 8%, compared to 10% for SBA and 12% for American Tower.
A few percent difference in return on invested capital may not seem like much, especially in any one given year. However, large investments at even a modestly inferior rate of return over a long period of time make a substantial difference in shareholder returns.
Impact on Shareholders
Had Crown employed the $15.7B it invested in fiber into its core business, it’s reasonable to expect EBITDA would be nearly $1B higher than today ($30B invested at an 11% incremental return compared to 8%). At its current ~75% EBITDA to AFFO conversion, AFFO would be about $750M higher. Applying Crown’s 27x forward AFFO multiple results in a $20B equity value opportunity cost for shareholders, or roughly 30% of the current market cap.
Not only has the business generated lower incremental growth in intrinsic value since shifting into fiber, but the market values its earnings differently than peers. American Tower and SBA are valued at ~31x AFFO compared to 27x for Crown. This 15% discount to peers has widened from a 2% discount five years ago, coinciding with Crown diversifying into a less attractive business model.
Over time these differences amount to major differences in shareholder returns. Since 2010 Crown shareholders have underperformed their peers by over 200%. The difference balloons to 700% over 15 years!

Source: Elliot Letter to Crown Board
Incentive Structure – The Root of the Problem
How has the management team been allowed to invest in a sub-optimal space when they had higher return opportunities squarely in their circle of competence at their fingertips? The problem appears to be an inappropriate incentive structure.
Crown’s board-approved incentive plan has three major flaws;
- No ROI-based metric for fiber capital expenditures
- No overall return on invested capital (ROIC) metric
- Unsuitable total stock return benchmarks
ROI for Fiber Capex
Crown has invested around $4.6B in fiber capex projects since 2015. This $4.6B has generated a measly $135M in organic EBITDA growth for a 3% return. According to Elliot, best-in-class fiber industry peers earn at least 40% on their capital investments.
Implementing ROI-based measures for capex projects as a “guide rail” would largely solve the problem. Like towers, maintenance capex for fiber is very low, making almost all capital expenditures discretionary. Lightower, a key competitor, outlined in 2016 how fiber capex works and how management teams can achieve higher yields by carefully selecting what kinds of projects to undertake.

Source: Elliot Presentation, Lightower investor 2016 presentation
The management team appears to be employing a “shotgun” approach with no guard rails for fiber capex. Without implementing specific goals for capital programs and measuring outcomes against those goals, a business can’t expect to earn adequate returns on reinvested capital, and Crown’s experience in fiber is a perfect example.
ROIC-Based Incentive Plan
Crown’s business is capital intensive, and therefore management should be compensated in large part for the returns earned on the capital they allocate. Crown’s executive incentive program is based on EBITDA and AFFO metrics. Neither of these measures include discretionary capital investments and let the team off the hook for underachieving investments.
Both American Tower and SBA extensively discuss and measure return on invested capital (ROIC) which is incorporated into the executive’s incentive plan. As Peter Drucker famously said, “what gets measured gets managed” and investors should demand that returns on their capital be measured above all else.
Total Stock Return Measures
Finally, it’s noteworthy that Crown measures its total stock performance and long-term incentive program (LTIP) against a fixed 11.5% benchmark, rather than peers or the S&P 500.
Because of its superior industry, Crown has only underperformed the market once in the last ten years. The tower industry has generated over 20% annual returns since 2009 and Crown’s arbitrary 11.5% goal is well below industry peers and its own historical performance, representing another governance head-scratcher.
Summary
As usual, Buffett put it best when asked how he judges management during a 1994 annual meeting:
“Well, I think you judge management by two yardsticks. One is how well they run the business and I think you can learn a lot about that by reading about both what they’ve accomplished and what their competitors have accomplished, and seeing how they have allocated capital over time. You have to have some understanding of the hand they were dealt when they themselves got a chance to play the hand…then you simply want to look at how well they have been doing in playing the hand, essentially, that’s been dealt.”
The Crown management team was dealt an exceptional hand – a leading position in an attractive tower industry. To be clear, Crown’s results have been far from a disaster. However, the management team has left substantial value on the table by diversifying away from their circle of competence. American Tower and SBA have outperformed Crown by over 200% in the last ten years and the only real difference is the management teams’ capital allocation approach.
The way we think of it, Crown Castle had a bullseye target, its tower business, well within sight. Instead of aiming at the center of the bullseye, Crown decided to expand its target, aiming for the edges in the fiber business.
Understanding incentive structures and capital allocation policies are core to evaluating any investment and are particularly useful when comparing industry competitors. Even in an excellent industry, capital allocation matters and can be the difference between good and great returns over long periods of time.
Disclosure: The author, Eagle Point Capital, or their affiliates may own the securities discussed. This blog is for informational purposes only. Nothing should be construed as investment advice. Please read our Terms and Conditions for further details.